

Defence spending and its short and longer-term macroeconomic effects
Prepared by Cristina Checherita-Westphal, Marta Rodríguez-Vives, Tibor Lalinský and Miles Parker
Published as part of the ECB Economic Bulletin, Issue 6/2026.
1 Introduction
Most European countries have committed to substantially increasing their spending on defence over the coming decade. This trend is underpinned by efforts towards reaching a higher target for defence spending by the North Atlantic Treaty Organization (NATO) and by recent European initiatives aiming to accelerate investment in defence and strengthen Europe’s strategic autonomy. At the June 2025 NATO summit, NATO member countries committed to spending 5% of GDP annually by 2035. At the July 2026 NATO summit, its member countries reaffirmed both that spending commitment and their support for Ukraine. The target of 5% of GDP consists of 3.5% core defence spending and 1.5% of GDP that can be devoted to other defence and security-related activities.
Most European countries significantly reduced their defence spending over the past three decades, following the end of the Cold War. This reallocation of public resources supported other policy priorities. However, it has also contributed to underinvestment in defence capabilities, a fragmented EU defence technological and industrial base (EDTIB) and a growing dependence on non-EU (primarily US) suppliers for critical military systems. Such fragmentation implies significant economic costs through duplicated procurement, limited economies of scale and reduced incentives for innovation capacity. Rebuilding defence capacities and strengthening the EDTIB will require sustained funding, greater coordination across EU Member States and more integrated procurement strategies.
Several EU-wide initiatives now support growth in defence spending and the EDTIB. The Readiness 2030 plan was launched by the European Commission in March 2025. First, the plan supports an increase in defence spending at the national level. Accordingly, under the Stability and Growth Pact (SGP), the activation of the national escape clauses (NECs) allows EU Member States to increase investment and other defence spending beyond previously agreed limits. The deviation is limited to a maximum of 1.5% of GDP during the period 2025-28 and is conditional on preserving medium-term debt sustainability. Second, the plan includes the Security Action for Europe (SAFE) instrument, with a total capacity of €150 billion, to provide loans to EU Member States to foster defence investments through common procurement. Third, the Readiness 2030 plan tasks the European Investment Bank with widening and scaling up the scope of its lending for defence and security projects. Finally, several other EU initiatives are boosting security assistance for Ukraine. They may not have a direct impact on the euro area economy, but may contribute indirectly to improved security and military capability in Europe.[1]
Aggregate euro area spending on defence could increase by almost 1 percentage point of GDP over the next decade and reach 2.5% of GDP in 2035, according to JANES budget database.[2] A breakdown by type of expenditure shows that in the medium term procurement will likely drive the increases in spending, while over longer horizons spending on personnel as well as on operations and maintenance are expected to dominate (Chart 1). Investment in defence research and development (R&D) in the euro area is marginal, in contrast to the expected contribution for the whole of NATO.
Chart 1
Defence spending trends by expenditure type (2024-35)
(left-hand scale: shares of total defence spending; right-hand scale: percentage of GDP)

Sources: JANES database and ECB staff calculations.
Notes: The euro area aggregate excludes Malta and Cyprus. The NATO aggregate excludes the non-NATO euro area countries Austria, Cyprus, Ireland and Malta. “Rest of the world” excludes the NATO member countries. Based on JANES data. R&D stands for research, development, testing and evaluation.
Higher defence spending in Europe has several macroeconomic implications. Military spending affects economic output through three principal channels: demand, supply and security (Dunne et al., 2005). In the short to medium run, government spending on infrastructure, military personnel and defence materiel stimulates domestic demand. The extent to which this affects economic activity depends, among other factors, on the degree to which the spending remains within the domestic economy. In the longer term, defence spending can increase aggregate supply by increasing the economy’s capital stock and encouraging innovation and technological development. Finally, greater domestic security can help alleviate the negative effects of geopolitical uncertainty on consumption and investment (Brignone et al., 2026). In what follows, Section 2 takes stock of defence spending in the euro area countries and discusses defence spending statistics. Section 3 shifts to the short and medium-term macroeconomic effects of increased defence spending, focusing on the horizon of the Eurosystem staff macroeconomic projections. Finally, Section 4 considers the longer-run influences on the supply side and economic growth.
2 Cross-country comparison of defence spending in the euro area
Defence spending as a share of GDP increased in most European countries in 2025 compared with 2024, although only four euro area countries are above 2% (Chart 2). Classification of the Functions of Government (COFOG) data on defence expenditure are the key reference for analysing how much governments spend on defence using national accounts. It is also the metric used in the European fiscal framework for assessing the activation of the NECs. According to these data, among the euro area countries that are NATO members, the Baltic countries and Greece spent more than 2% of GDP on defence in 2025, while Slovakia, Bulgaria and France were close to that threshold. By contrast, the expenditure of non-NATO euro area countries continued to be low (e.g. Ireland 0.1% of GDP or, equivalently, 0.3% of GNI*,[3] Malta 0.5% of GDP and Austria 0.7% of GDP) except for Cyprus, which spent 1.8% of GDP. Compared with 2024, the estimated euro area aggregate increased slightly by 0.1 percentage points to almost 1.5% of GDP in 2025. The estimated average for 2025 is slightly higher than 1.5% of GDP when taking into account only NATO member euro area countries.
Chart 2
Defence spending across COFOG and NATO data sources
(percentage of GDP)

Sources: Eurostat (2026b, April), NATO (July 2026) and European Defence Agency.
Notes: The European Defence Agency (EDA) collects data from the defence ministries of all EU Member States and some non-EU countries, regardless of NATO membership. The ordering of countries is according to COFOG defence spending as a share of GDP in 2025. For Ireland, Spain and the Netherlands, the 2025 COFOG data shown are proxied by 2024 COFOG data and the growth in defence investment over 2024-25. For Italy and Cyprus, the 2025 COFOG data shown are proxied by 2023 COFOG data and the growth in defence investment over 2023-25. For the non-NATO EU Member States, 2025 NATO defence spending is approximated by the latest available EDA defence spending data for 2025 and marked by the patterned yellow triangles. There are two estimated euro area aggregates displayed: euro area (EA) contains all 21 countries, while euro area* (EA*) only contains the NATO member euro area countries.
The defence spending-to-GDP ratios have increased for most euro area countries according to NATO data. The differences between the COFOG and NATO databases arise from several factors, as explained in Box 1. The differences between the two data sources generally widened in 2025, which may have been driven by timing differences in the recording of major purchases of equipment. For example, COFOG 2025 data show a ratio of 1.5% of GDP for Germany in 2025, whereas NATO data indicate 2.2% of GDP. All the euro area NATO member countries, except Slovenia, have already reached 2% of GDP in defence spending according to the NATO measure. Hence, the estimated euro area NATO aggregate was close to 2.2% of GDP in 2025 (and at 2.0% of GDP for the aggregate across all euro area countries).
For most euro area countries, public investment in defence increased in 2025 and represented more than 20% of the defence budget (Chart 3). Expenditure on defence is mostly allocated to compensation of employees, followed by intermediate consumption and investment, with the composition being rather stable over time. After limited change in 2024, however, in 2025 most euro area countries reported a growing defence investment-to-GDP ratio. Overall euro area aggregate defence investment spending increased by 0.3 percentage points of GDP relative to 2024. Moreover, in 2025 most euro area countries allocated more than 20% of their defence budget to investment. Although in most euro area countries defence investment accounts for a relatively low share of total public investment, it is becoming both a more structural component and more relevant for Europe’s long-term growth and fiscal strategy. Over time, this may also lead to higher current expenditure (intermediate consumption) due to the specific costs associated with maintaining a higher stock of military equipment.
Chart 3
Public investment and investment in defence in 2025
(percentage of GDP)

Source: Eurostat (2026b, April).
Notes: The ordering of countries is according to total public investment spending (P.51G) as a percentage of GDP in 2025. Investment in defence is defined in the SGP as gross fixed capital formation (P.51G). The euro area countries are grouped into countries that have activated the national escape clause (NEC; bars on the left) and non-NEC countries (lighter bars, on the right).
Box 1
Understanding defence spending statistics
Prepared by Marta Rodríguez-Vives
Assessing the recent increase in defence spending is not straightforward, as different statistical frameworks coexist. The two most widely used sources are the national accounts-based COFOG and NATO defence expenditure statistics. While both are broadly similar in scope, aiming to capture resources devoted to defence, they differ in terms of accounting principles and statistical objectives.
COFOG defence spending (division 02) provides a functional classification of government expenditure within the European System of Accounts (ESA 2010) and is therefore the preferred framework for analysing the role of defence spending in public finances and fiscal policy in the EU. NATO statistics, by contrast, are designed to monitor defence efforts and military capabilities across Alliance members and follow a slightly broader concept. NATO figures for defence expenditure are hence generally higher than those for COFOG defence spending (see Eurostat, 2026a, 2026b). Several factors explain the discrepancies between the two measures.
- NATO expenditure is largely recorded on a cash basis, whereas national accounts follow the accrual accounting principle: expenditure is recorded when economic ownership changes, not when payments are made. This can generate substantial differences in individual years during re-arming periods, when large military procurement projects with long delivery times are ongoing. However, the cash-accrual discrepancies will tend to diminish in the long run once ownership has been fully transferred.
- The scope of core defence expenditure is broader under NATO’s 3.5% of GDP commitment. Notably it includes military pensions, healthcare spending for military personnel, and other defence and security-related costs. In national accounts, pensions for military employees are recorded under social protection (COFOG category 10) and healthcare for military personnel under health (COFOG category 07).
- A more significant challenge arises from NATO’s additional 1.5% of GDP commitment, for which there is no single equivalent COFOG category. The component “other defence and security-related expenditure” includes protection of critical infrastructure, defence networks, civil preparedness and resilience, innovation, and strengthening the defence industrial base. In national accounts, this expenditure is distributed across several COFOG functions, notably general public services (category 01), public order and safety (category 03) and economic affairs (category 04).
- Another statistical clarification concerns defence capabilities, as the composition of spending is at least as important as its aggregate level. Compensation of employees and intermediate consumption – covering the goods and services used in the day-to-day provision of defence services, such as fuel, maintenance and repair, logistics and other operational inputs – primarily contribute to maintaining existing capabilities. By contrast, capital formation reflects the accumulation of assets that expand or modernise defence capabilities. In national accounts (Table A), government investment in defence (P51G) comprises gross fixed capital formation classified under COFOG division 02 (Defence), including military weapon systems and military infrastructure.[4] However, a significant component of military capability-building may be recorded under changes in inventories (P52). Ammunition, missiles, rockets, bombs and other single-use military items are not treated as fixed assets in national accounts. Rather, they are treated as inventories until they are used and afterwards classified as intermediate consumption. Excluding inventories would underestimate the resources devoted to strengthening defence capabilities in the current geopolitical environment. As highlighted by the European Commission (2025), capital formation captures long-term investments in military capabilities. It covers not only military infrastructure and weapon systems, such as aircraft, warships and tanks, but also the accumulation of ammunition and missile inventories. For this reason, and as shown in Table A, future analysis of defence investment could focus on gross capital formation (P5) rather than on gross fixed capital formation (P51G) alone, as the former provides a more comprehensive measure of the resources devoted to strengthening military capabilities.
- Finally, COFOG and NATO rely on different sources for the GDP denominator.
Table A
Defence expenditure in national accounts: which components relate to military capacity?
Component (ESA code) |
Examples |
Relevance for capacity building |
|---|---|---|
Compensation of employees |
Military salaries and allowances |
Maintains existing forces |
Intermediate consumption |
Fuel, maintenance costs, logistics, training |
Supports operational readiness. Training is important for current and future military capabilities. |
Social benefits |
Military pensions and related benefits |
Limited direct impact on current capabilities |
Gross fixed capital formation |
Aircraft, warships, tanks, military infrastructure, weapon systems |
High |
Changes in inventories |
Ammunition, missiles, rockets, bombs, spare military supplies |
High |
Gross capital formation |
Best measure of investment in future military capabilities |
Source: Authors, based on ESA 2010.
3 Fiscal and macroeconomic implications of rising defence spending over the short and medium term
The additional euro area defence spending since the Munich Security Conference in early 2025 is incorporated in the June 2026 Eurosystem staff projection baseline, and reaches 1.5% of GDP cumulatively over 2025-28 (Chart 4, panel a). This spending includes military support to Ukraine (0.24% of GDP cumulatively over 2025-28). The estimates have been revised upwards by about 0.4 percentage points compared with the Eurosystem staff’s first estimate in the June 2025 projections.[5] In part, this reflects more countries specifying new defence plans in enough detail to be incorporated into the staff projection baseline. Germany continues to account for the bulk of these new measures, including most support for Ukraine. Purely in terms of additional national defence spending, which is relevant for assessing the direct macroeconomic impact, Germany accounts for somewhat more than 70% of the total incorporated in the June 2026 projection baseline. Only the Baltic countries rank higher on defence spending as a share of GDP. The majority of the additional national spending over the period 2025-28, at the euro area aggregate level and in most countries, relates to investment (71%). The rest is mostly for government consumption, tilted more towards intermediate consumption (21%) than personnel expenditure (6%; Chart 4, panel b).
Chart 4
Additional defence spending incorporated in the Eurosystem staff projections baseline since the Munich Security Conference (early 2025), euro area aggregate
a) Amount of additional defence spending |
b) Composition of additional national defence spending |
|---|---|
(percentage of GDP) |
(vertical axis: percentage of GDP; bars: percentage share of components in national defence spending) |
 |
 |
Sources: Eurosystem staff macroeconomic projections for the euro area, June 2026 and ECB calculations.
In terms of macroeconomic impact, defence spending is a notable driver of euro area growth over the projection horizon, while the inflation impact is projected to be muted (Chart 5). The additional defence spending incorporated in the baseline since the Munich Security Conference is estimated to increase real GDP growth by 0.4 percentage points cumulatively over 2025-28, with a peak effect in 2026.[6] While increasing towards the end of the horizon, the expected impact on euro area inflation is limited and less than 0.1 percentage points cumulatively over 2025-28. This result primarily reflects the projected composition of the additional defence spending (mostly on capital with a low share of personnel spending, which tends to have limited inflationary effects as shown in Box 2, part 2).
Chart 5
Macroeconomic effects of the additional national defence spending on the Eurosystem projection baseline, euro area aggregate
(percentage points)

Sources: Eurosystem staff macroeconomic projections for the euro area, June 2026 and ECB calculations.
Notes: The macroeconomic effects are aggregated at the euro area level based on country-specific estimates using simulation models provided by the Eurosystem’s national central banks. They are expressed as a percentage point deviation from a baseline without the additional defence spending, keeping monetary policy, exchange rate and financial spreads fixed at their baseline values. The fiscal shocks used in model simulations are calculated in marginal terms (corresponding to the annual change in the national defence spending component shown in Chart 4, panel a). HICP stands for Harmonised Index of Consumer Prices.
The baseline estimates are subject to uncertainty. The risks to the baseline are, overall, assessed to be tilted towards higher defence spending (see Box 2, part 1). Furthermore, the relatively high growth but low inflation impact of the additional defence spending over the Eurosystem projection horizon and beyond is contingent on several factors. In particular, the impact hinges on the response of the supply side and whether, in future, spending on capital will increase relative to spending on personnel (see the next section and the analysis in Box 2, part 2). Other factors, such as the expectations of households and firms, will also play a role. In the euro area, households’ expectations about the impact of defence spending on the economy and their financial wellbeing are closely linked to their beliefs about how such spending will be financed and their country’s level of public debt (see Baumann et al., 2025).[7] Finally, there is also considerable estimation uncertainty regarding the GDP fiscal multipliers of defence spending with respect to, among other factors, the composition of spending, the timing of announcements, and transmission mechanisms (see the empirical analysis in Box 2, part 2).[8]
Box 2
The macroeconomic effects of defence spending beyond the projection baseline: model-based scenario analysis and empirical evidence
Prepared by Cristina Checherita-Westphal, Georg Müller and Laust Særkjær
1. Scenario analysis of risks to the euro area June 2026 projection baseline from higher defence spending
First, Eurosystem staff assessed the risks of additional defence spending over 2026-28 as stemming mostly from government announcements that were insufficiently detailed to be included in the baseline at the cut-off date of the June 2026 projections. Such risks, based on country-specific expert judgement, were found to be limited at the euro area aggregate level (Chart A, dark blue bars). Staff also assessed the likely composition of such additional defence spending (tilted towards government investment) and its possible financing through higher taxes and/or cuts in other spending (assessed as being limited). Macroeconomic simulations of such risk scenarios indicate that the cumulated real GDP growth effects would be limited to below 0.1 percentage points over 2026-28, while the inflation impact would be negligible.
Chart A
Scenario analysis of risks to the euro area projection baseline from higher defence spending over 2026-28
(percentage points of GDP and percentage point deviation from the baseline)

Source: ECB staff calculations based on Eurosystem staff risk assessments in the context of the June 2026 projections.
Notes: HICP stands for Harmonised Index of Consumer Prices. The left-hand panel shows the calibration and the effects of scenario ranges on an annual basis, while the right-hand panel shows them in cumulative terms over 2026-28 for three illustrative scenarios (I1-I3). The range of the dark blue bars is given by the scenarios for additional defence spending both with compensatory financing measures (assessed as being limited) and without (fully debt-financed). In the illustrative scenarios (light blue bars), the fiscal shock from scenario I1 (gradually increasing defence spending to reach the 5% of GDP NATO target at euro area level by 2035) is calibrated without compensatory measures (full debt financing). The range of macroeconomic results is based on simulations with the ECB’s main euro area projection model (ECB-BASE), keeping monetary policy, exchange rate and financial spreads fixed at their baseline values.
Second, illustrative risk scenarios considered higher additional defence spending to reach the 5% of GDP NATO target at euro area level by 2035. These scenarios could yield more significant growth effects (between 0.7 and 1 percentage points cumulatively over 2026-28). The impact on inflation, albeit increased, would remain limited over the projection horizon (Chart A, light blue bars). The range of macroeconomic effects depends on various assumptions on the underlying parameters. In particular, increasing the import content of public spending from a 19% average benchmark value (in the central scenario I1) to 50% (scenario I2) lowers the growth effect by about 0.2 percentage points cumulatively, with milder impacts on inflation. Higher labour market tightness (scenario I3) leads to a larger inflation impact owing to higher wage pressures (while also boosting the estimated growth impact due to an increase in households’ disposable income). Finally, the estimates in these illustrative scenarios can be regarded as upper limits. The analysis abstracts from possible financial market tensions if government debt ratios are not put on a declining path over the medium term in line with the requirements of the Stability and Growth Pact, particularly in the highly indebted euro area countries (see Bouabdallah et al., 2025 for more detailed analyses on the sustainability implications).
2. Empirical analysis of the macroeconomic effects of defence spending across EU Member States over 1999-2025
This part complements the model-based results above with an empirical analysis across EU Member States drawing from Checherita-Westphal and Særkjær (2026). It contributes to the empirical literature in several ways. First, it goes beyond GDP multipliers, which are the focus of most empirical studies, to investigate in detail the price effects of defence spending. Second, in exploiting Eurostat’s COFOG functional classification of government expenditure (see Box 1), the analysis aims at improving the estimation of the timing of the fiscal “shock” to account for the fact that purchases of large military equipment are only recorded as defence spending upon delivery – and therefore with a lag. To this end, it adjusts the capital component of COFOG defence spending data using a country-specific “delivery time delay” proxy constructed based on the SIPRI Arms Transfers Database.[9] Third, the analysis captures very recent developments in the EU Member States’ defence build-up by using defence spending data up to and including 2025, as available.
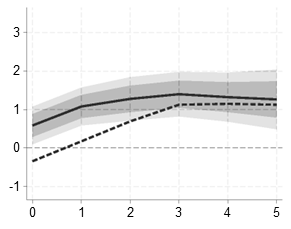
The analysis finds that aggregate defence spending generates a cumulative GDP multiplier of around unity at its peak, which occurs later and is more prolonged in the “adjusted” specification (Chart B, left panel). Price effects are positive and statistically significant, with GDP deflator growth effects higher than inflation according to the Harmonised Index of Consumer Prices (HICP). This reflects the fact that defence-specific cost pressures go beyond pressures on consumer prices and are more directly captured through government spending deflators (Chart B, middle and right panels). The cumulative HICP inflation effect after a 1% of GDP increase in defence spending peaks at 1.3 percentage points in the third year in the “adjusted” specification, where the effects are stronger than in the unadjusted one. Nonetheless, as shown below, this relatively high impact on inflation depends heavily on the composition of defence spending. Larger delivery delays than the historical norm in a situation of high demand for military equipment and supply constraints would mean a more delayed peak in GDP effects and an earlier and higher onset of inflation. Finally, the GDP effects are surrounded by substantial uncertainty, as indicated by the wide confidence bands.
Chart B
Impact of total defence spending and propagation channels
Defence spending with “adjusted” capital (dashed line: unadjusted)
GDP |
HICP inflation |
Deflator growth |
|---|---|---|
(y-axis: percentage deviation from trend GDP; x-axis: horizon in years) |
(y-axis: percentage points; x-axis: horizon in years) |
(y-axis: percentage points; x-axis: horizon in years) |
 |
 |
 |
Source: Authors’ calculations.
Notes: Estimates for the sample of 27 EU Member States for 1999 to 2025 estimated dynamically using the Panel Local Projection method of Jordà (2005). The panels show cumulative effects over a five-year horizon after a 1% of trend GDP increase in defence spending (the fiscal shock occurs in year 0). The cumulative GDP multiplier follows the specification of Ramey and Zubairy (2018). The GDP variable is expressed in real terms and is normalised to lagged trend GDP. The baseline includes a range of lagged control variables as well as country and time fixed effects. The levels indicated by the confidence bands are: grey 68%; light grey 90%.
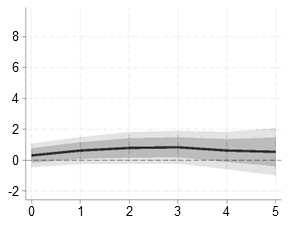
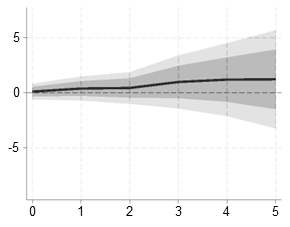
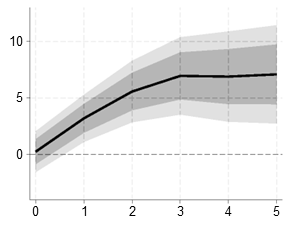
The macroeconomic effects and the propagation channels depend on the type of defence spending (Chart C). Capital defence expenditure is the primary source of GDP increases, whereas higher personnel spending generates relatively stronger deflator effects. Personnel spending, which has the largest share in total defence spending (over 50% in our sample), mostly acts through increasing households’ consumption while crowding out private investment. Its very large effect on the GDP deflator growth on impact (at time 0 when the shock occurs) in part reflects a direct effect on the government consumption deflator through the channel of higher public wages. Both capital and personnel spending contribute to a deterioration in the trade balance. For capital spending, as opposed to personnel costs, there is no evidence for crowding out of private investment (crowding-in effects, while not statistically significant in the full sample, are strong if outlier observations are excluded).
Chart C
Breaking down total defence spending: the impact of capital and personnel spending
a) Cumulative impact of “adjusted” capital spending
GDP |
HICP inflation |
Deflator growth |
|---|---|---|
(y-axis: percentage deviation from trend GDP; x-axis: horizon in years) |
(y-axis: percentage points; x-axis: horizon in years) |
(y-axis: percentage points; x-axis: horizon in years) |
 |
 |
 |
Household consumption |
Net exports |
Private investment |
(y-axis: percentage of trend GDP; x-axis: horizon in years) |
(y-axis: percentage of trend GDP; x-axis: horizon in years) |
(y-axis: percentage of trend GDP; x-axis: horizon in years) |
 |
 |
 |
b) Cumulative impact of personnel spending
GDP |
HICP inflation |
Deflator growth |
|---|---|---|
(y-axis: percentage deviation from trend GDP; x-axis: horizon in years) |
(y-axis: percentage points; x-axis: horizon in years) |
(y-axis: percentage points; x-axis: horizon in years) |
 |
 |
 |
Household consumption |
Net exports |
Private investment |
(y-axis: percentage of trend GDP; x-axis: horizon in years) |
(y-axis: percentage of trend GDP; x-axis: horizon in years) |
(y-axis: percentage of trend GDP; x-axis: horizon in years) |
 |
 |
 |
Source: Authors’ calculations.
Notes: The estimates for the sample of 27 EU Member States from 1999 to 2025 were prepared using the Panel Local Projection (LP) method of Jordà (2005). The panels show cumulative effects over a five-year horizon after a 1% of trend GDP increase in defence spending (fiscal shock in year 0). The cumulative GDP multiplier follows the specification of Ramey and Zubairy (2018). GDP and all other variables, apart from inflation and GDP deflator growth, are expressed in real terms and normalised to lagged trend GDP. The baseline includes a range of lagged control variables as well as country and time fixed effects. The levels indicated by the confidence bands are: grey 68%; light grey 90%.
4 Longer-term impact on output and productivity
Defence spending can boost longer-term economic activity and productivity if it brings about structural change, notably through delivering economies of scale, reallocating current production as well as creating technological spillovers to civilian production. There are productivity benefits arising from economies of scale, learning by doing and technological spillovers (see Ilzetzki, 2025). The size of such productivity gains depends on the type and location of spending as well as a number of structural factors. Defence equipment usually involves high-tech manufacturing, so higher domestic defence production can improve productivity if it causes capital and labour to be reallocated from less productive activities. The impact of this reallocation will be smaller if a large share of defence equipment is imported. Defence R&D spending can also generate productivity spillovers to the civilian sector. By contrast, spending on military personnel has been shown to have a lower impact on growth (see Box 2), since it can potentially move workers away from more productive roles in the civilian sector.
There is some evidence of a pivot towards domestic arms manufacturing and concurrent improvements in labour productivity. Greater domestic production provides more opportunity to generate economies of scale and lower the unit cost of production. The annual accounts of major European defence contractors show that between 2021 and 2024 their revenues increased and they also posted higher value added per worker. Further economies of scale may be obtained by focusing European procurement on a narrower set of pan-European major weapon systems. At present, European defence spending is fragmented along national lines with a proliferation of systems relative to the United States. Attempts to create joint European systems, such as the Franco-German-Spanish Future Combat Air System, have at times run into difficulty.
Knowledge spillovers may occur within regions where defence production takes place, or along supply chains. The production of major European defence firms is highly concentrated in certain regions. The 12 largest euro area defence firms and their subsidiaries exceed 5% of total manufacturing employment in several euro area NUTS1 regions.[10] When also taking into account defence companies’ suppliers, the degree of regional concentration is smaller. Less than 20% of suppliers of the top euro area defence firms operate in the same region or country, with an additional 25% of suppliers located elsewhere in the euro area, and about 50% outside of the EU (Figure 1, panel a). The location of subsidiaries indicates somewhat stronger regional ties, with around 10% of subsidiaries located within the same region (Figure 1, panel b). However, the overall intra-euro area or intra-EU subsidiary network covers only 40% of all subsidiaries. That may limit the potential for knowledge spillovers across the euro area, although there may also be opportunity for knowledge transfer from imported equipment. At the same time, the large share of non-EU suppliers highlights the EU’s dependence on, and vulnerability to, external providers for key inputs and potentially critical defence systems.
Figure 1
Top defence firms’ linkages with suppliers and subsidiaries
a) Supplier locations |
b) Subsidiary locations |
|---|---|
(percentage) |
(percentage) |
 |
 |
Sources: Bloomberg Finance L.P. and Moody’s.
Notes: Panel a) shows the share of suppliers relative to the total number of suppliers to top euro area defence firms. Panel b) shows the share of subsidiaries relative to the total number of subsidiaries of top euro area defence firms.
Higher defence production may also improve aggregate productivity by reallocating resources away from less productive activities. Major defence firms are, on average, more productive than other manufacturing firms in about half of the regions where they are present (Figure 2, panel a). Reallocating employment from civilian to defence firms in those regions could therefore increase aggregate productivity as a result of a direct composition effect.
Figure 2
Defence sector productivity and employment dynamics
a) Relative productivity of top defence firms |
b) Net job rate in the automotive industry and employment share of defence firms |
|---|---|
 |
 |
Sources: Moody’s and Eurostat.
Notes: Panel a) shows the mean value added per employee in top defence firms and their subsidiaries operating in the manufacturing sector over the mean value added per employee in the manufacturing sector in NUTS1 regions in 2023. Below (above) mean figures represent a productivity share below (above) mean productivity in the manufacturing sector. Panel b) shows the net job rate calculated as the difference between the intra-regional job creation and job destruction rates in firms from the automotive industry (C29 in the NACE Rev. 2 classification) between 2018 and 2023. Low and high shares indicate whether employment in top defence firms, including their suppliers and subsidiaries, accounts for a below or above-median share of total employment in the region in 2023 respectively.
Higher labour demand by defence firms might create opportunities for productivity-enhancing labour reallocation without creating regional labour market tensions. Between 2018 and 2023 the share of total manufacturing employment in total employment declined in several euro area regions. Notably, employment in the automotive industry fell in most euro area regions over the same period. These are regions in which top defence firms employ a higher share of workers (Figure 2, panel b, orange regions). In those regions an increase in defence spending may therefore be absorbed without intensifying labour market pressures.
The final channel through which higher defence spending can bolster long-run output and productivity is through spillovers from defence R&D to civilian productivity. Public spending, notably on basic research, appears to have particularly high economy-wide returns. ECB analysis shows that increasing the government subsidies for R&D and technology adoption by 1% of GDP could raise output by 1.5% in the long run (ECB, 2024). An increase in defence spending of 1% of GDP has been estimated to increase total factor productivity by 0.3% over the long run, primarily through spillover effects from public R&D (Antolin-Diaz and Surico, 2025). A recent study also finds that increasing public R&D spending by 10% results in private sector R&D increasing by 5-6% (Moretti et al., 2025).
To bolster the long-run growth impact of defence spending, it is crucial to increase the relatively low rates of defence R&D spending in Europe. Public defence R&D accounted for just 0.03% of GDP in the EU in 2022, compared with 0.08% in the United Kingdom and 0.3% in the United States. Assuming defence-related R&D has the same economic effect as government-funded R&D, catching up to the US rate could increase EU GDP by 0.5% in the long run (see Box 3). Beyond this direct impact, public sector R&D also raises the returns to private sector R&D, stimulating further private sector spending on R&D. According to estimates from a model calibrated to the Spanish economy, this could add a further 0.15 percentage points to annual GDP growth over the long run (see Box 3).
Box 3
Economic benefits of higher public R&D defence spending
Prepared by Rubén Domínguez-Díaz and Miles Parker
Using an off-the-shelf endogenous growth model calibrated to the Spanish economy as an illustrative case, this box analyses the effects of defence R&D spending on long-run output. In the model, households and companies choose how much to invest in physical capital and labour. Firms can also invest in innovation, which boosts their total factor productivity (TFP). We represent defence R&D as public investment in basic research that increases the available stock of knowledge and so enhances the returns to private sector R&D. We calibrate the magnitude of these spillovers using available firm-level empirical evidence on the impact of public R&D on private R&D investment from the United States.
We consider a large permanent increase in the public R&D-to-GDP ratio of 0.3 percentage points, to approximately the same level as defence R&D in the United States. Reaching such a level would be challenging, but it serves as a benchmark for estimating the upper bound of the potential effects of defence R&D. Chart A shows the total response of R&D spending as a share of GDP over a ten-year horizon. The stock of knowledge generated by public R&D quickly benefits the private sector owing to high elasticity of private R&D with respect to public R&D, creating positive spillovers that encourage firms to themselves allocate more resources to R&D.
Chart A
Change in R&D spending
(percentage point share, as a percentage of GDP)

Source: ECB staff calculations based on Domínguez-Díaz et al. (2025).
Higher R&D spending by private firms raises TFP, boosting long-run GDP growth by roughly 0.15 percentage points per year, on average (Chart B). On impact, however, GDP declines, reflecting the trade-off inherent in R&D spending: resources are allocated today towards innovation that yields future productivity gains rather than immediate output. That initial reallocation of resources results at first in lower output than if these resources had continued to be allocated to consumption or investment. At the same time, any increase in labour demand in R&D-intensive sectors is partly offset by firms’ shift toward more capital and knowledge-intensive innovation activities, temporarily lowering labour intensity. Over time the productivity gains prevail. Higher productivity also spills over to private investment, increasing the returns on private capital and boosting the capital contribution.
Chart B
GDP growth and contributions
(percentage point deviation from steady state for contributions; percentage points for GDP growth)

Source: ECB staff calculations based on Domínguez-Díaz et al. (2025).
Finally, Chart C shows the cumulative multiplier of public R&D spending, which captures by how much GDP increases for each euro of public R&D invested. While the multiplier is negative in the short term, reflecting the initial reallocation of resources discussed above, it is well above unity in the long term, as private sector R&D and investment increase. Over the long run each €1 of additional government R&D spending can generate almost €2.5 of GDP.
Chart C
Cumulative R&D multiplier
(increase in GDP per €1 of public R&D investment)

Source: ECB staff calculations based on Domínguez-Díaz et al. (2025).
5 Conclusions
Most European countries have committed to substantially increasing their defence spending over the coming decade. As a response to the intensification of geopolitical tensions and the agreement on higher NATO defence spending targets of 5% of GDP by 2035, most euro area countries increased their defence spending, including defence investment, in 2025. Looking ahead, based on the plans that have been announced, the major efforts to boost national defence spending are expected to be concentrated in Germany and the Baltics.
In the short and medium term, defence spending is expected to be an important driver of growth in the euro area if these spending plans materialise. The expected cumulative percentage point contribution to growth over the period 2025-28 ranges from 0.4 in the projection baseline to 1 in the most favourable risk scenario. The expected impact on inflation is limited. The actual impact would depend on several factors, such as the composition of spending, with capital as opposed to personnel spending having the potential to lift growth while keeping inflation contained.
Over the longer run, higher defence spending will have only a limited impact on the level of economic activity in the euro area unless there are changes to its composition. The historically large share of imported defence equipment limits the potential for higher domestic productivity growth, as does the relatively high share of spending on personnel. Substantially increasing the spending on R&D could generate larger productivity and growth effects over longer horizons, as dual-use technologies and knowledge spillovers improve the returns to private sector R&D and bolster innovation. Increasing the domestic share of production and reducing the degree of fragmentation of spending could also bolster the productivity gains.
The macroeconomic effects of defence spending analysed here are surrounded by high uncertainty, also in relation to the sustainability of higher spending. At present, higher defence spending is compatible with the EU fiscal framework thanks to the activation of the NECs from 2025 to 2028, provided that a higher pace of consolidation is subsequently implemented to preserve debt sustainability.[11] Limitations to the fiscal space in some highly indebted countries may warrant consideration of the size and composition of their fiscal budgets after the transitory period. This may lead to a greater need to prioritise defence spending over other government functions or to increase taxation. However, reducing spending on, for example, health and education comes with opportunity costs that can affect economic growth negatively over the long run. Failing to increase spending to match greater threats to national security also comes with potential costs, ranging from rising geopolitical uncertainty to the economic effects of sabotage and, at the limit, invasion.
References
Antolin-Diaz, J. and Surico, P. (2025), “The Long-Run Effects of Government Spending”, American Economic Review, Vol. 115, No 7, pp. 2376-2413.
Baumann, A., Checherita-Westphal, C., Kocharkov, G. and Osterloh, S. (2025), “Higher defence spending and its impact on household expectations”, Economic Bulletin, Issue 5, ECB.
Bokan, N., Jacquinot, P., Lalik, M., Mueller, G., Priftis, R. and Rigato, R. (2025), “Macroeconomic impacts of higher defence spending: a model-based assessment” Economic Bulletin, Issue 6, ECB.
Bouabdallah, O., Checherita-Westphal, C., De Stefani, R., Haroutunian, S., Hauptmeier, S., Huber, C., Momferatou, D., Muggenthaler-Gerathewohl, P., Setzer, R. and Zorell, N. (2025), “Medium-term fiscal-structural plans under the revised Stability and Growth Pact”, Economic Bulletin, Issue 3, ECB.
Bouabdallah, O., De Stefani, R., Haroutunian, S. and Leiner-Killinger, N. (2026) “How Today’s Choices Shape Tomorrow’s Fiscal Adjustment under the Reformed EU Framework”, Journal of Economics and Statistics, forthcoming.
Brignone, D., Gambetti, L. and Ricci, M. (2026), “Geopolitical risk shocks: When size matters”, European Economic Review, Vol. 188, 105392.
Checherita-Westphal, C., Huber, C., Rodríguez-Vives, M. and Müller, G. (2025), “Fiscal aspects of European defence spending: implications for euro area macroeconomic projections and associated risks”, Economic Bulletin, Issue 5, ECB.
Checherita-Westphal, C. and Særkjær, L. (2025), “Fiscal multipliers of defence spending: a short review of the empirical literature”, Box 1 of Bokan, N., Jacquinot, P., Lalik, M., Müller, G., Priftis, R. and Rigato, R. (2025), “Macroeconomic impacts of higher defence spending: a model-based assessment”, Economic Bulletin, Issue 6, ECB.
Checherita-Westphal, C. and Særkjær, L. (2026), “The Macroeconomic Effects of Defence Spending: What Impact beyond GDP?”, paper presented at the WGPF/Bank of Lithuania public finance workshop, Vilnius, July.
Domínguez-Díaz, R., Hurtado, S. and Menéndez, C. (2025), “Fiscal stimulus and productivity: simulating the NGEU program with an endogenous growth model”, SERIEs, Vol. 16, pp. 191-228.
Dunne, J., Smith, R. and Willenbockel, D. (2005), “Models of military expenditure and growth: a critical review”, Defence and Peace Economics, Vol. 16, No 6, pp. 449-461.
European Central Bank (2024), “Challenges for monetary and fiscal policy interactions in the post-pandemic era”, Occasional Paper Series, No 337.
European Commission (2025), “The economic impact of higher defence spending”, Special Issues – Spring 2025 Economic Forecast.
European Defence Agency, EDA Defence Data 2025-2026, 16 July.
Eurostat (2026a), “Guidance Note on the statistical recording of defence expenditure”, Guidance Notes (Methodology), 22 April.
Eurostat (2026b), “EU economic governance framework indicators – national co-financing of EU programmes and defence expenditure”, Statistics Explained, April.
Ilzetzki, E. (2025), “Guns and Growth: The Economic Consequences of Defense Buildups”, Kiel Report, No 2, February.
Jordà, Ò. (2005), “Estimation and Inference of Impulse Responses by Local Projections”, American Economic Review, Vol. 95, No 1, pp.161-182.
Moretti, E., Steinwender, C. and Van Reenen, J. (2025), “The Intellectual Spoils of War? Defense R&D, Productivity, and International Spillovers”, The Review of Economics and Statistics, Vol. 107, No 1, pp. 14-27.
North Atlantic Treaty Organization (2026), “Defence investment of NATO countries (2014-2026)”, press release, 3 July.
Ramey, V. and Zubairy, S. (2018), “Government spending multipliers in good times and in bad: Evidence from U.S. historical data”, Journal of Political Economy, Vol. 126, No 2, pp. 850-901.
Legal Disclaimer:
EIN Presswire provides this news content "as is" without warranty of any kind. We do not accept any responsibility or liability for the accuracy, content, images, videos, licenses, completeness, legality, or reliability of the information contained in this article. If you have any complaints or copyright issues related to this article, kindly contact the author above.
